| |
|
| |
|
| |
| For the year ended 31st December |
2023
Rs. Mn |
2022
Rs. Mn |
|
For the year ended 31st December |
2023
Rs. Mn |
2022
Rs. Mn |
|
|
|
| INCOME STATEMENT |
|
|
SHAREHOLDER'S EQUITY |
|
|
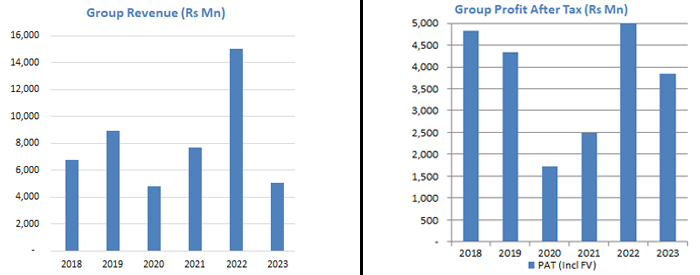
| Revenue |
5,076 |
15,046 |
|
Stated Capital |
18,443 |
18,443 |
| Gross Profit |
3,319 |
6,843 |
|
Reserves |
35,676 |
33,346 |
| Fair Value Gain (FVG) |
499 |
317 |
|
|
|
|
| |
|
|
|
FINANCIAL RATIOS |
|
|
| Profit Before Tax (PBT) |
4,311 |
7,025 |
|
Gross Profit Margin |
65% |
45% |
| Profit After Tax (PAT) |
3,853 |
6,079 |
|
PAT (including FVG) Margin |
76% |
40% |
|
|
|
|
|
|
|
|
|
|
|
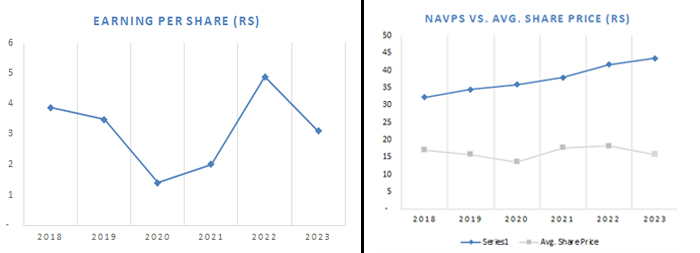
Earnings Per Share
(including FVG) |
3.10 |
4.89 |
| |
|
|
|
|
|
|
| STATEMENT OF FINANCIAL POSITION |
|
|
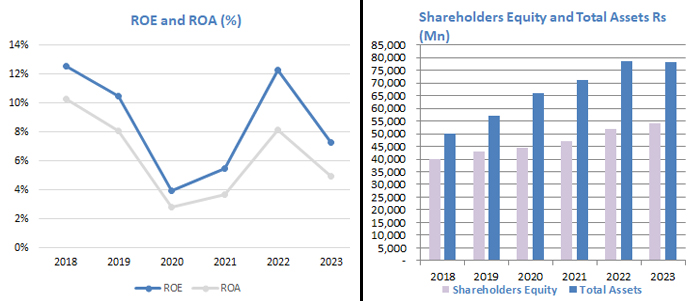
Return on Equity |
7% |
12% |
| Total Assets |
78,234 |
78,392 |
|
Return on Assets |
5% |
8% |
| Total Liabilities |
24,115 |
26,603 |
|
Debt Equity Ratio |
36% |
43% |
| Loans and Borrowings |
992 |
2,686 |
|
Net Assets Per Share |
43.54 |
41.66 |
| |
|
|
|
Dividend Payout Ratio |
40% |
26% |
| |
|
|
|
PE Ratio |
5 |
4 |
| |
|
|
|
|
|
|
| |
| * The share price taken is the average of the lowest
and highest share prices during the year |
| |
|
|